The smog did not strike like an explosion. It entered homes, stopped transport, filled hospitals, and left a death toll that statistics revealed after the yellow-black air had lifted.
Archive record
- Dates: December 5–9, 1952
- Immediate estimate: about 4,000 excess deaths
- Main pollutants: coal smoke and sulfur compounds trapped by inversion
- Policy legacy: Clean Air Acts of 1956 and 1968
When ordinary smoke stopped moving
Cold weather settled over London in early December, and residents burned more coal for heat. A layer of warmer air sat above colder air at the surface, creating a temperature inversion that prevented vertical mixing. With little wind, smoke from domestic chimneys, power stations, industry, and vehicles accumulated close to the ground.
London had known fog for generations. Coal particles gave it color and odor, producing the famous 'pea-souper.' Familiarity made the first hours seem inconvenient rather than catastrophic. This episode became different because the inversion persisted while emissions continued, driving visibility and air quality far beyond normal winter conditions.
A city reduced to a few feet
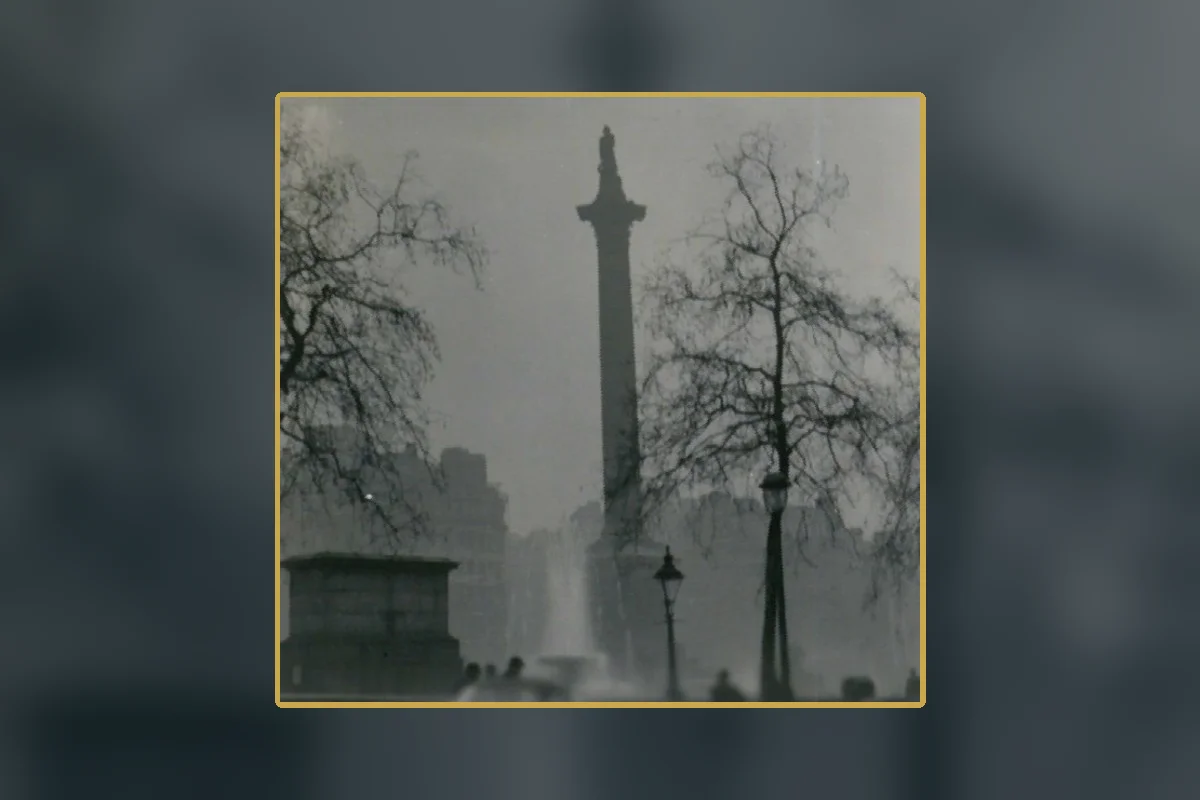
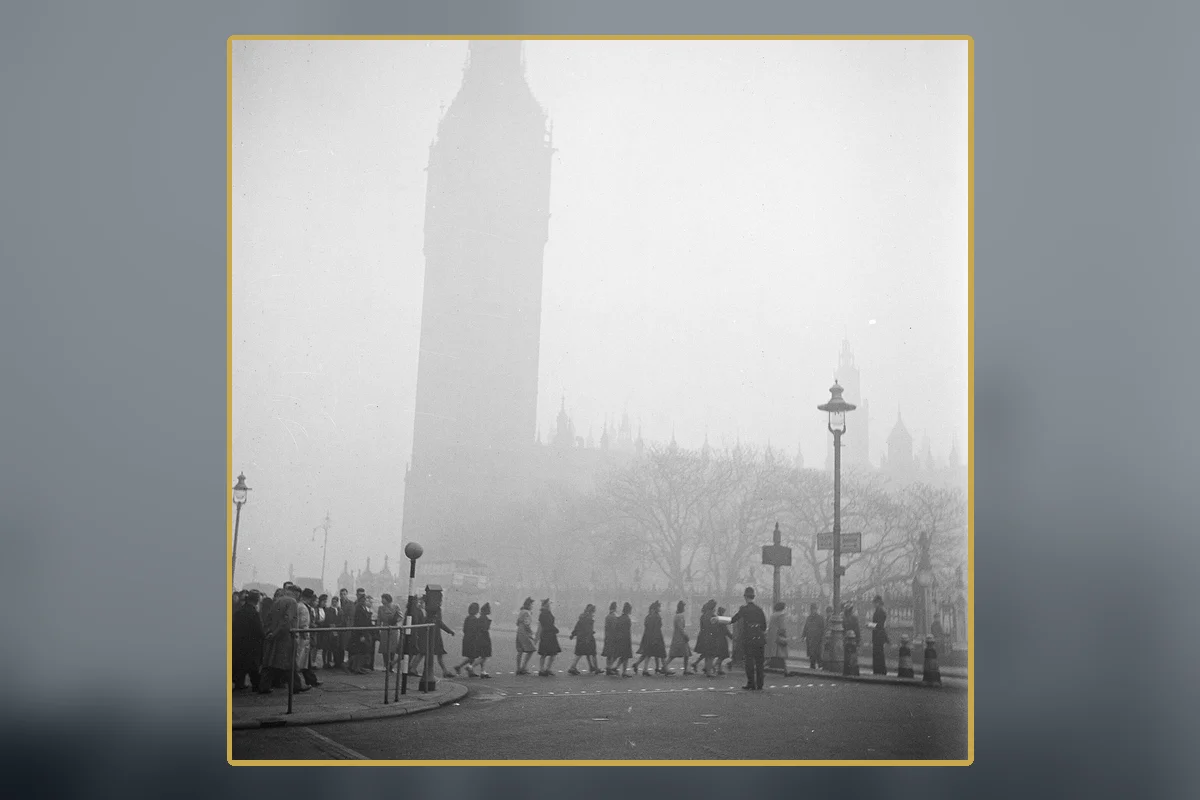
Visibility fell to meters and sometimes less. Buses stopped or required guides walking in front. Trains slowed, river traffic struggled, flights were disrupted, and ambulances could not navigate normally. Smog entered buildings, coating surfaces and darkening cinema screens. Livestock at an agricultural show reportedly suffered breathing distress.
Personal navigation became dangerous because curbs, traffic, and even one's own feet disappeared. Yet disruption is not the same as the disaster's main harm. Fine particles and acidic pollution penetrated lungs. People with heart or respiratory disease, infants, and older residents were especially vulnerable.
Deaths hidden inside routine records
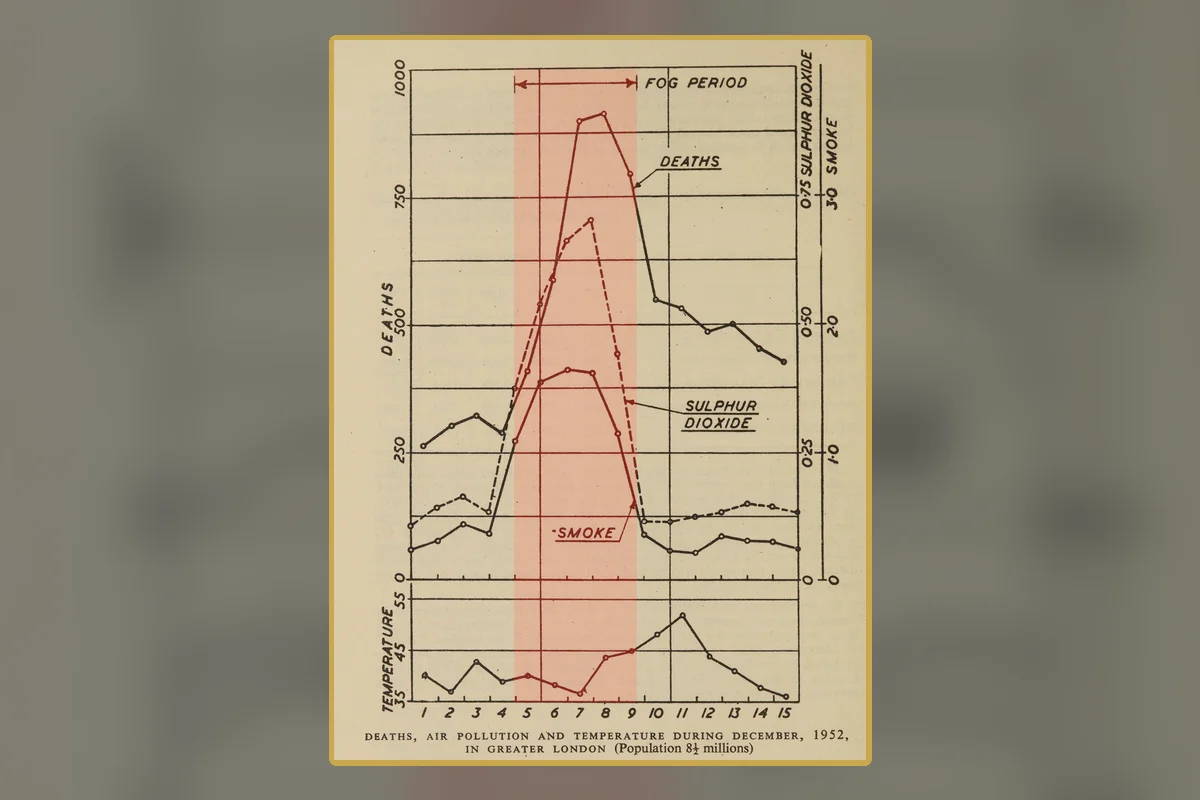
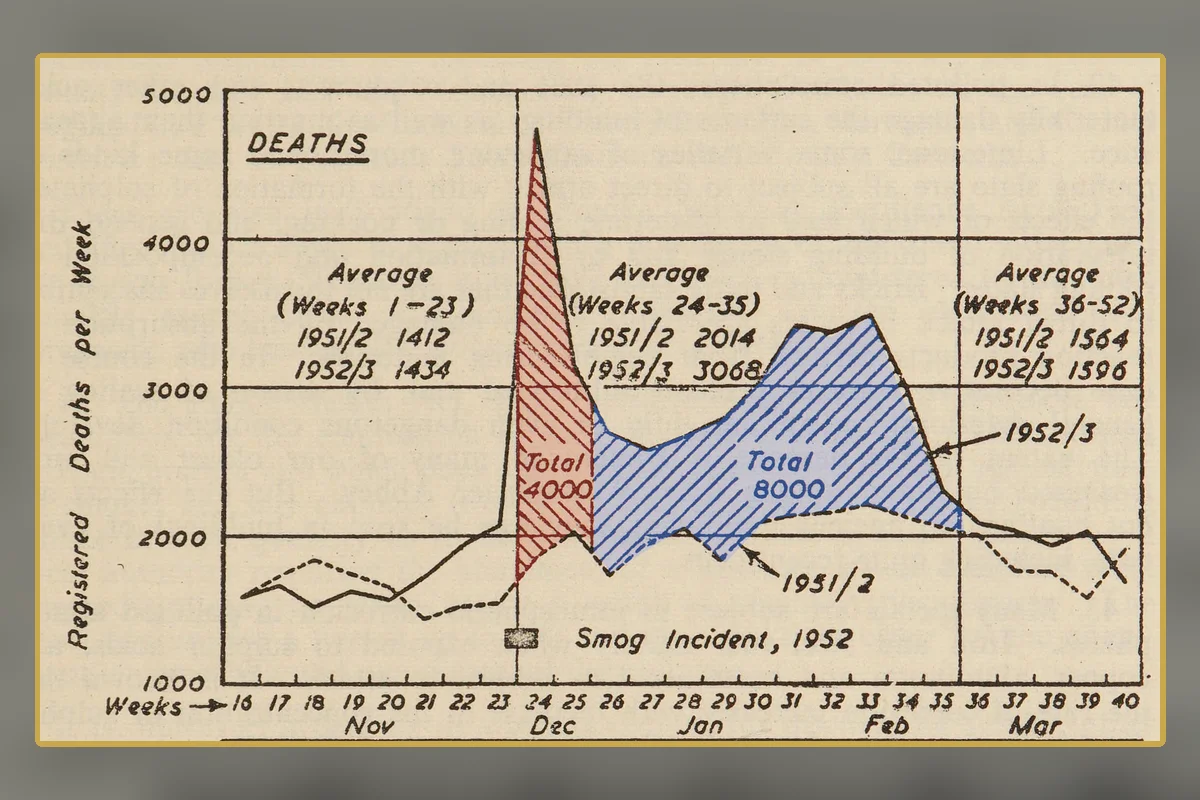
There was no single moment when officials counted a crowd of victims. Hospitals filled with respiratory cases, undertakers ran short of coffins, and weekly mortality rose. Analysts comparing deaths during and after the episode with expected levels identified roughly 4,000 excess deaths in the immediate period. Later research suggested a substantially higher total when delayed effects were included.
The delayed count explains why the smog was initially easier to minimize than a visible mass-casualty event. Pollution worsened existing illnesses and produced deaths across homes and hospitals. Statistical comparison made a dispersed environmental exposure legible as one disaster.
What chemistry added to the fog
Soot was only part of the mixture. Burning high-sulfur coal released sulfur dioxide, which under foggy conditions contributed to sulfuric acid droplets. Recent research has refined the chemical pathways, but the broad mechanism is clear: concentrated emissions reacted in moist air and remained trapped where people breathed.
Domestic coal mattered because millions of small chimneys collectively created a major source. Power generation and industry added to the load. The disaster therefore challenged a political instinct to locate blame only in a few factories; cleaner urban air required changing fuels and heating systems across whole districts.
From accepted nuisance to preventable harm
Public pressure, medical evidence, and government investigation moved air pollution from the realm of unavoidable weather toward policy. The Clean Air Act 1956 established smoke-control areas and supported conversion to cleaner fuels. Later legislation expanded controls. Implementation took years and imposed real household and infrastructure costs.
The law did not emerge from the smog alone; reformers had worked on smoke abatement for decades. But December 1952 supplied an undeniable demonstration that familiar pollution could become lethal under predictable weather. It gave dispersed evidence a public story.
The lesson cities keep relearning
The Great Smog is sometimes told as a sepia-toned episode solved by one act of Parliament. London improved, but pollution sources changed rather than disappeared. Vehicle emissions and fine particles created new challenges, while cities elsewhere repeated combinations of fuel burning, inversion, and delayed health effects.
Its most durable lesson is methodological. Environmental deaths may be invisible at the bedside and unmistakable in population data. When a hazard is familiar, gradual, and widely shared, the archive of excess mortality can reveal a disaster that the eye fails to count.
What the record supports—and what it does not
The Great Smog was not simply natural fog, and its death toll was not completely visible during the five days. Weather trapped a human-made mixture of coal smoke and sulfur pollution. About 4,000 excess deaths were recognized early; later studies indicate more delayed mortality, so precise totals depend on the period and method counted.
Evidence ledger
- WEATHER — A temperature inversion: Warmer air above London trapped cold polluted air near the surface.
- SOURCE — Millions of coal fires: Domestic heating joined power stations, industry, and vehicles in the stagnant air.
- VISIBILITY — Transport nearly stopped: Buses needed walking guides, flights halted, and smog entered buildings.
- HEALTH — Deaths emerged statistically: Roughly 4,000 immediate excess deaths were recognized; delayed effects raised the burden.
- CHEMISTRY — More than soot: Sulfur compounds in wet air contributed acidic pollution deep in the smog.
- LEGACY — Clean air became law: The 1956 Act established smoke-control areas and supported cleaner fuel conversion.
How this reconstruction was built
The smog's archive is partly statistical. Weather observations and pollution measurements explain the trapped air, while weekly mortality and hospital data reveal harm dispersed across thousands of homes. Totals differ because researchers count different windows of immediate and delayed death. Reporting both the early figure and the likelihood of a larger burden is more accurate than presenting one dramatic number as a final headcount.
To audit the account, open the source links below and compare dates, quantities, and the wording used by the institutions themselves. Look for the earliest recoverable record, then distinguish it from later summaries created after the story became famous. The five visuals in this article are archival photographs, maps, documents, objects, or clearly identified editorial diagrams selected to illuminate the surviving record. Each caption identifies its source and rights information; no reconstruction is presented as a historical photograph. That transparency is part of the Lore & Archive method.
Why this story matters
This history shows why public-health evidence often arrives as a pattern rather than a dramatic object. It also explains how a tolerated nuisance can become a regulated hazard once causation and scale are made visible.
Continue in the archive
- Inside the Greenbrier Bunker: Congress's Secret Cold War Refuge
- The Halifax Explosion: The Collision That Destroyed a City in Seconds
- The Antikythera Mechanism Was More Than a Curiosity
Sources and further reading
Editorial note: Lore & Archive distinguishes contemporary evidence, later institutional synthesis, and unresolved inference. Where sources disagree or the record is incomplete, the uncertainty is stated rather than converted into a dramatic fact.